EDR Agent Portal
Monitor all endpoints, view event telemetry, run forensics, and quarantine compromised hosts.
/edr/agents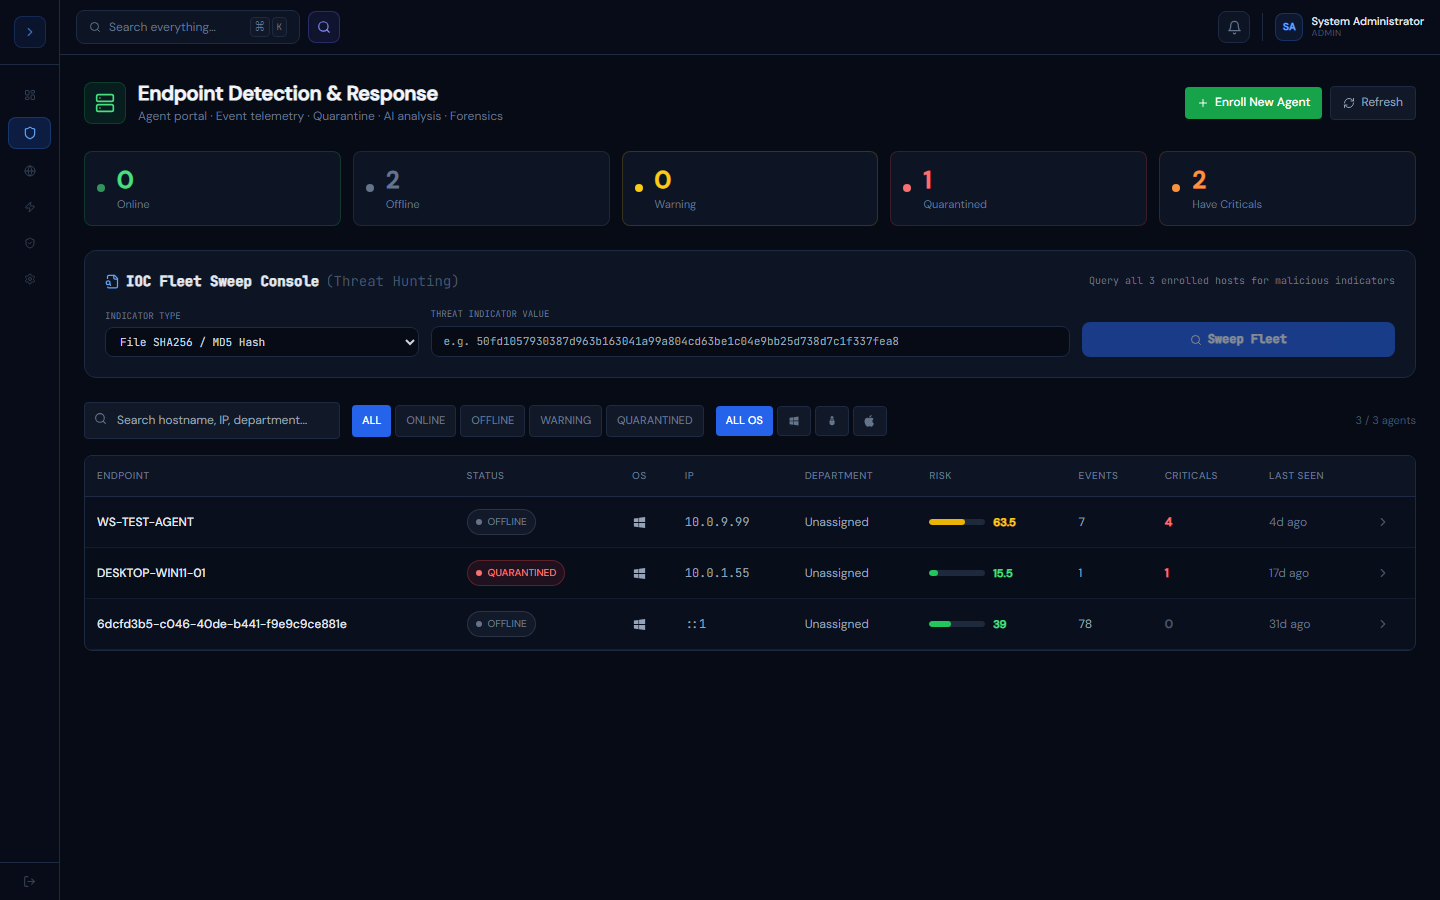
How the EDR works
OverviewHow the EDR Works
GuardFox Security Systems's EDR consists of two parts: a lightweight agent running on each endpoint, and the Agent Portal in the web UI.
What the agent collects
| Category | What's captured |
|---|---|
| ETW | Process creation, injection, hollow shell detection via Windows ETW providers |
| FileSystem | Mass file rename (ransomware), new executables in temp paths |
| VSS | Shadow copy deletion attempts — detected and alerted, not blocked. The agent matches vssadmin delete shadows on process creation, by which point the command has already run. Auto-containment can kill the process afterwards, but it is opt-in and off by default. Windows only. |
| PowerShell | Script block logging — captures all commands including obfuscated ones |
| YARA | Operator-dispatched scan of a process's on-disk executable image — not live memory. Linux and macOS only; not implemented on the Windows agent. Requires a ruleset supplied with the scan: none ships with the product, so a scan reports "no YARA ruleset was supplied" until you provide one. |
| Win Events | Advanced Windows Event Log analysis (4624, 4688, 4698…) |
| Network | Outbound connections, DNS queries, C2 interval detection |
Agent communication
- Agent sends heartbeat to
/api/edr/heartbeatevery 30 seconds - Events stream to
/api/edr/eventsin batches of 50 - Commands (quarantine, scan, collect) are polled from
/api/edr/commands - Tamper protection: the agent service cannot be stopped without the admin passphrase
Quarantining an endpoint
How to useQuarantining an Endpoint
Quarantine isolates a compromised endpoint from the network using local firewall rules, while keeping the agent connection alive so you can still collect forensics.
How to quarantine
- Open EDR → Agent Portal
- Click any agent to open the detail drawer
- Click Quarantine in the top-right
- Confirm the action — a note is added to the audit log
What quarantine does
- Adds iptables (Linux) or Windows Firewall rules blocking all inbound/outbound traffic
- Exception: keeps ports 443 to the GuardFox Security Systems server open so the agent remains connected
- The agent status changes to QUARANTINED (red pulsing dot)
Releasing quarantine
Click Release in the same location. The firewall rules are removed and normal connectivity resumes.
⚠️ Always collect a memory image via the Forensics tab before releasing a quarantined endpoint.
Remote forensics collection
How to useRemote Forensics Collection
From the Agent detail drawer → Forensics tab, you can launch collection tasks without touching the endpoint.
Available tasks
What collection actually returns today: a running-process snapshot. On every platform collect_artifacts ignores the requested artifact type and captures a process listing, returning a summary that says so ("Full <type> collection is not yet implemented on this platform"). Memory dumps, RAM images, MFT/prefetch parsing and filesystem timelining are not implemented on Windows, macOS or Linux. Do not plan an investigation around them — use the process snapshot, or collect from the host directly.
| Task | What it collects today | Status |
|---|---|---|
| Artifact Collection | Running-process snapshot (pid, command) | Implemented |
| Process Memory Dump | — | Not implemented — returns the process snapshot |
| Full Memory Image | — | Not implemented — returns the process snapshot |
| File System Timeline | — | Not implemented — returns the process snapshot |
| Prefetch / MFT Analysis | — | Not implemented — returns the process snapshot |
A real memory dump needs a per-platform capture path the agent does not have: task_for_pid plus the debugger entitlement on macOS, MiniDumpWriteDump on Windows, process_vm_readv on Linux. Prefetch and MFT are Windows-only NTFS artifacts with no equivalent on the other two.
Running a collection
- Open the agent drawer → Forensics tab
- Click the task you want to run
- Status changes to Running with a live progress indicator
- When Complete, click Download to retrieve the artifact
Notes
- Full Memory Image requires the agent to have local admin rights
- Collections run in the background — you can navigate away and return
- Results are stored on the GuardFox Security Systems server for 7 days then auto-deleted
Reading the Events tab
OverviewReading the Events Tab
Open any agent's detail drawer → Events tab to see everything that endpoint has reported. Every row is built from the agent's real telemetry — process starts, network connections, file operations, registry changes, and script executions — translated into a plain-language summary instead of a raw JSON dump.
What a row shows
- Title & description — e.g. "Process started" with "notepad.exe (PID 4821) started, parent PID 900", or "Outbound connection" with the full src/dst addressing
- Severity badge — Critical / High / Medium / Low, colour-coded
- MITRE tag — when the event maps to a known technique (e.g.
T1486), shown as a purple chip - Process, path, command-line, or network destination detail — filled in per event type
List vs. Timeline layout
Toggle between ≡ List (grouped cards, good for scanning) and ↕ Timeline (chronological, numbered, better for reconstructing an attack sequence) using the buttons above the event list.
Expanding raw data
Click any event row to expand the full underlying JSON payload — useful when you need a field the summary view doesn't surface.
Filtering out noise
How to useFiltering Out Noise
A busy endpoint generates a huge volume of routine telemetry — most of it never a security finding. The Events tab hides two categories by default so the signal doesn't get buried:
Hidden by default
- Low-severity events of any kind
- Raw telemetry — every network connection, registry touch, file write, process start/exit, and script execution, regardless of severity. This is safe to hide: whenever the agent's detection engine actually finds something in one of these areas, it escalates the event to a named rule (e.g.
ransomware_encrypt,c2_beacon,reg_run_key) instead of leaving it tagged as the raw category — so a genuine finding is never among what's hidden.
Toggling it back on
Click 🔇 Raw telemetry noise hidden to reveal everything (it becomes 👁 Showing raw telemetry noise). It also switches on automatically if you click the LOW severity quick filter, or type network, registry, file, process, or script into the category filter box — otherwise those searches would silently return nothing while the noise filter is active.
The status line under the filters — "Matched X of Y EDR logs · N noisy events hidden" — always shows how much is currently filtered out.
Triaging events: acknowledge, dismiss, and bulk actions
How to useTriaging Events
Every event carries a triage status — New, Acknowledged, or Dismissed — so a backlog can actually be worked down instead of growing forever.
Per-event actions
Each row has Acknowledge and Dismiss links. Acknowledging marks it reviewed without hiding it; dismissing removes it from the default view (it's tracked, not deleted — see below to bring it back).
Working through a batch at once
Clicking every row individually doesn't scale once there's more than a handful of the same low-value thing. Instead:
- Narrow the list with the severity quick filters or the category/title search box
- Click Select all N filtered (top-right of the event list) to select the entire matching set in one click
- Use the bulk action bar that appears — Acknowledge all or Dismiss all — to act on the whole batch at once
Individual checkboxes on each row are also available if you want to hand-pick a subset instead.
Bringing dismissed events back
Dismissed events are hidden by default, same as noise — click ✓ Dismissed hidden to show them (it becomes 🗑 Showing dismissed). The status line reports how many are currently hidden.
Response actions vs. real detections vs. simulated tests
OverviewResponse Actions vs. Real Detections vs. Simulated Tests
Three kinds of rows can appear in the Events tab, each badged distinctly so you never mistake one for another while triaging:
| Badge | What it means |
|---|---|
| RESPONSE ACTION | An action you or another operator dispatched from the dashboard — quarantine, release, kill process, memory/artifact collection, uninstall, file deletion, IP block. (A YARA scan is dispatchable through the API but has no dashboard control, and needs a ruleset you supply with the request.) Shows who dispatched it and its current status (e.g. "Dispatched by [email protected] — complete"). Never colour-coded by severity, since it isn't a threat — it's a record of what the SOC did. |
| SIMULATED | A test event fired from the Simulator tab to exercise playbooks and response workflows. Looks like a real detection in every other respect (same title, same severity) but is clearly marked so a test run is never confused with an actual intrusion. |
| Severity badge (Critical/High/Medium/Low) | A genuine finding from the agent's detection engine — no special marker beyond the severity colour itself, since this is the real signal everything else exists to distinguish itself from. |
Deleting a malicious file remotely
How to useDeleting a Malicious File Remotely
Any event row with a file path (e.g. a file-write or a detection referencing a dropped executable) shows a Delete File button next to the path.
- Click Delete File next to the path you want removed
- A delete-file command is queued to the agent — you'll see a confirmation toast
- The agent removes the file the next time it polls for commands
⚠️ This deletes the file on the live endpoint. Collect a forensic copy first (Forensics tab → Artifact Collection) if you might need it later for investigation or legal hold.
Editing agent configuration
How to useEditing Agent Configuration
Open the agent drawer → Config tab to see identity and protection settings.
What's editable
- Department — click Edit next to it to reassign the endpoint to a different department/team for reporting and filtering purposes.
What isn't, and why
Agent ID, OS, Agent Version, and IP Address are read-only — the agent itself reports these on every heartbeat, so an edit here would just get silently overwritten on the next check-in and desync from what's actually running.
Also on this tab
- Protection Features — toggle Tamper Protection on/off; the other listed protections (ETW, FileSystemWatcher, VSS, PowerShell logging) are always-on and shown for visibility, not individually toggleable. YARA scanning is not always-on: it runs only when a scan is dispatched, only on Linux and macOS, and only if a ruleset is supplied with the scan.
- Applied Policies — click a policy chip to attach or detach it from this endpoint (baseline, ransomware-protect, vss-protect, dc-hardening, usb-block, linux-hardening).