Dashboard
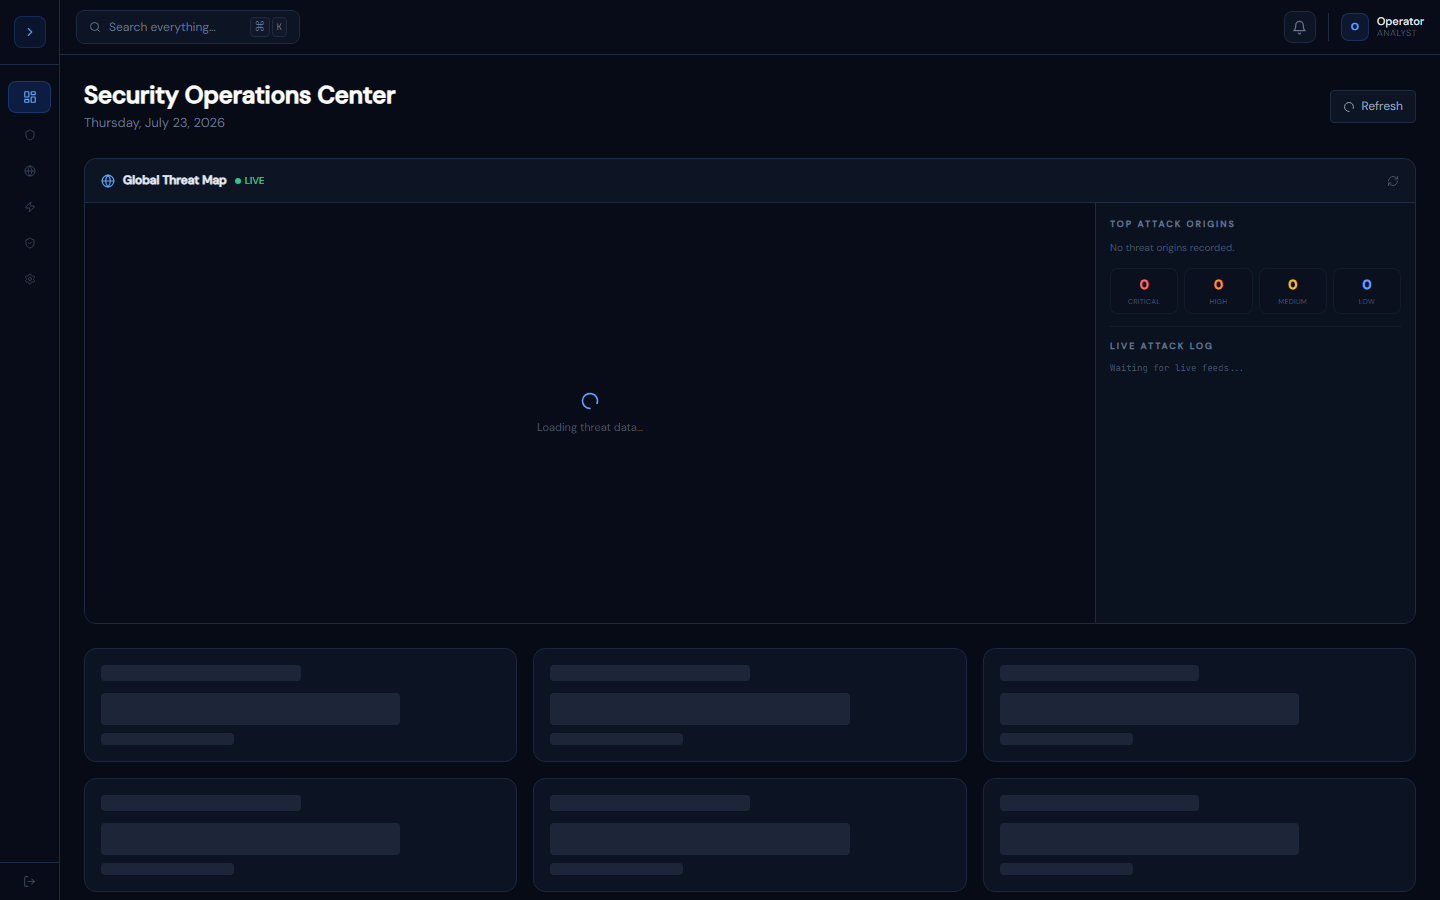
Real-time security operations overview — alert counts, SIEM volume, agent health, severity breakdown, and quick actions. Auto-refreshes every 60 seconds from live Prisma data.
/
How the dashboard works
OverviewHow the Dashboard Works
The dashboard pulls live data from your PostgreSQL database via /api/dashboard/stats on every page load and then auto-refreshes every 60 seconds silently in the background.
What each stat card shows:
| Card | Data source | What it means |
|---|---|---|
| Open Alerts | Alert table, status not closed | Alerts needing analyst attention |
| Critical | Alert filtered by severity + open | Immediate action required |
| SIEM Events | SIEMEvent count last 24h | Ingestion pipeline health |
| Agents Online | EdrAgent status=active | Endpoint coverage |
| Open Tickets | Incident table open/in_progress | Case management load |
| AI Triage Rate | Alerts with ai-triaged tag | Automation effectiveness |
Trend arrows
- 🔴 Up arrow on Open Alerts = more alerts than expected (>5 new today)
- 🟢 Down arrow = fewer than expected (good)
- The dashboard uses simple threshold logic, not ML
If the dashboard shows zeros
Either no data has been ingested yet (normal on first setup) or the API route failed. Check the error banner — it shows the HTTP status and retries in 60 seconds.
Getting data into the dashboard
SetupGetting Live Data Into the Dashboard
The dashboard is empty until data flows in. Three things need to happen:
1. Connect a SIEM source
Go to Administration → Data Sources and configure a connector. The easiest is the generic webhook:
curl -X POST https://portal.guardfoxsecurity.com/api/siem/ingest \
  -H "Content-Type: application/json" \
  -H "X-GuardFox-Source: generic" \
-d '{"message":"Test event","severity":"info","host":"test-host"}'2. Install an EDR agent
Follow the Quick Start → Install First EDR Agent guide. Within 60 seconds of the agent sending its first heartbeat, it appears in the Agents Online count.
3. Let alerts generate
The SIEM ingest pipeline automatically creates alerts for any Critical or High severity events. Or create one manually in Alert Explorer.
Once these three are done, the dashboard fills with real data.